U-Admin Analytics
Generate reports and display the data generated for decision-making
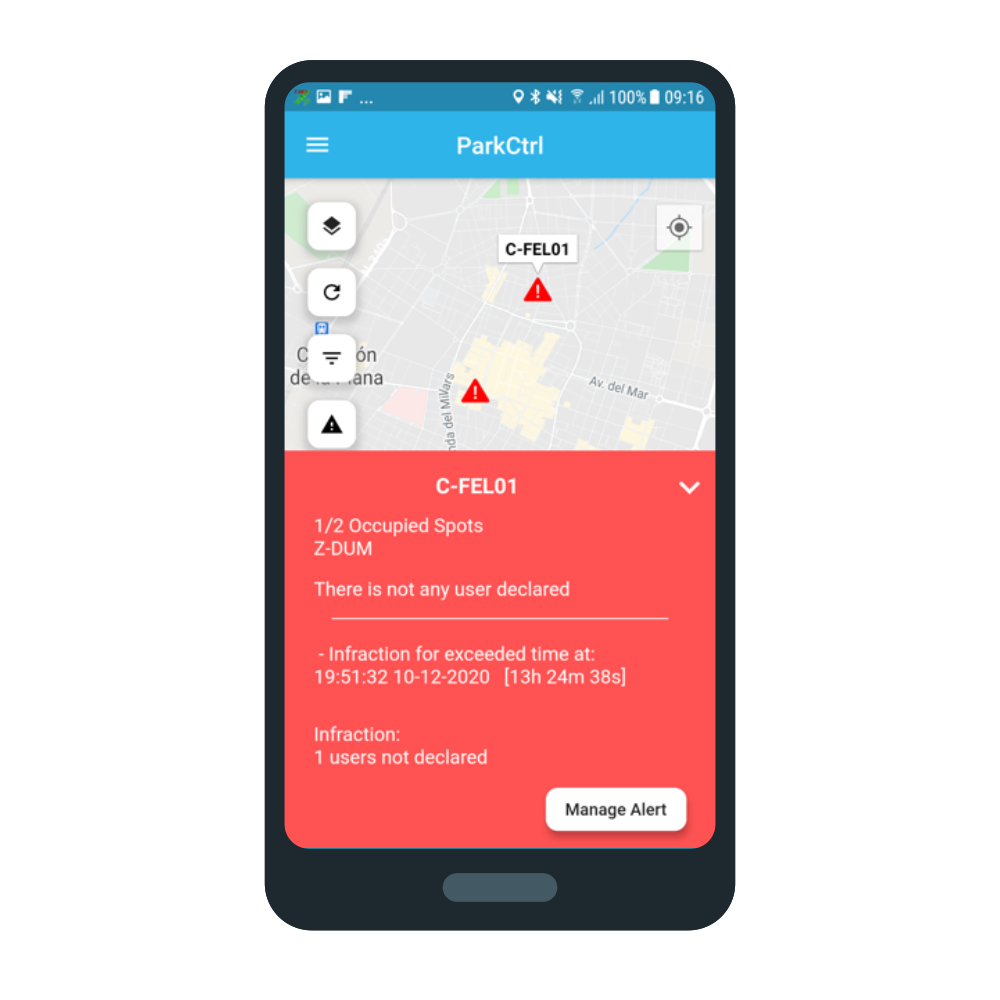
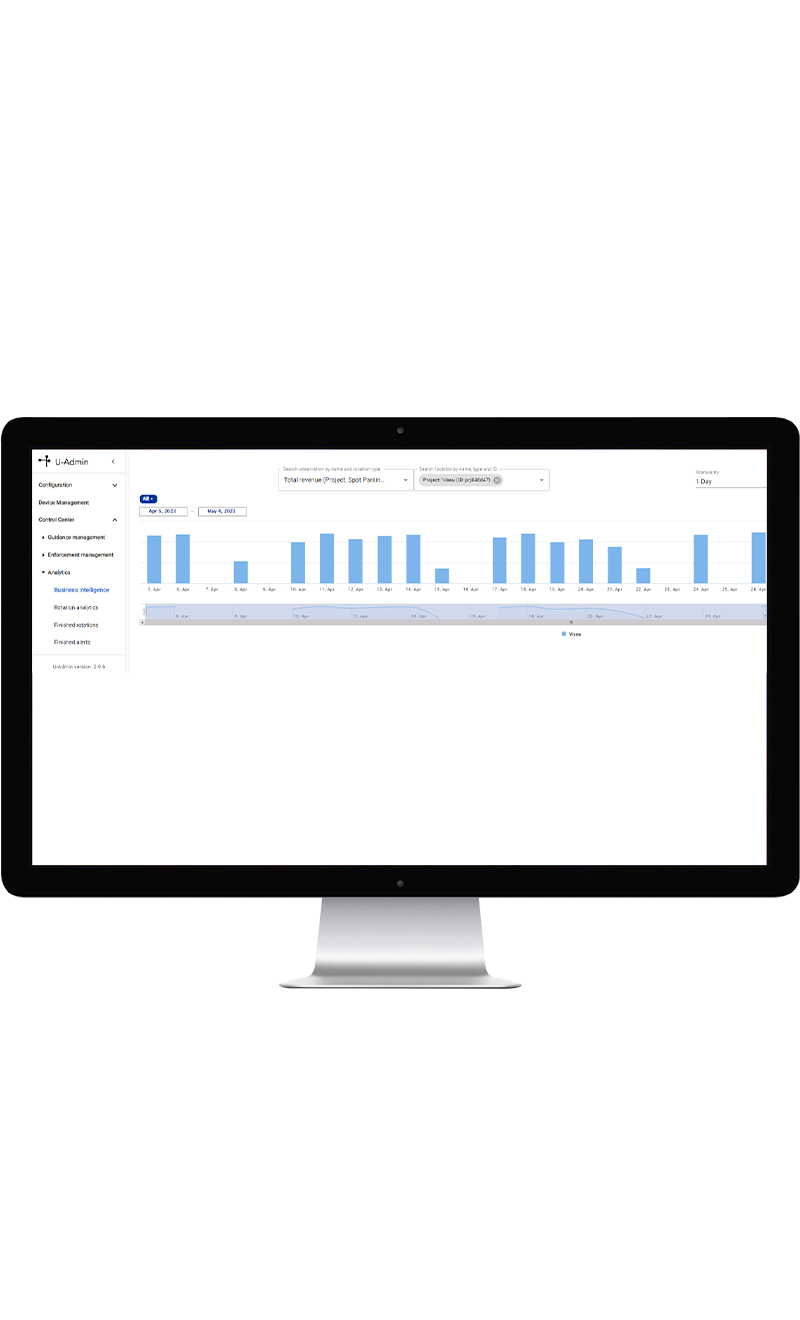
This section shows everything from a panel with a variety of Business Intelligence graphs to rotation tables and completed alerts. It provides revenue graphs and reports for projects in the United States where there is revenue from tickets or notice of reports.
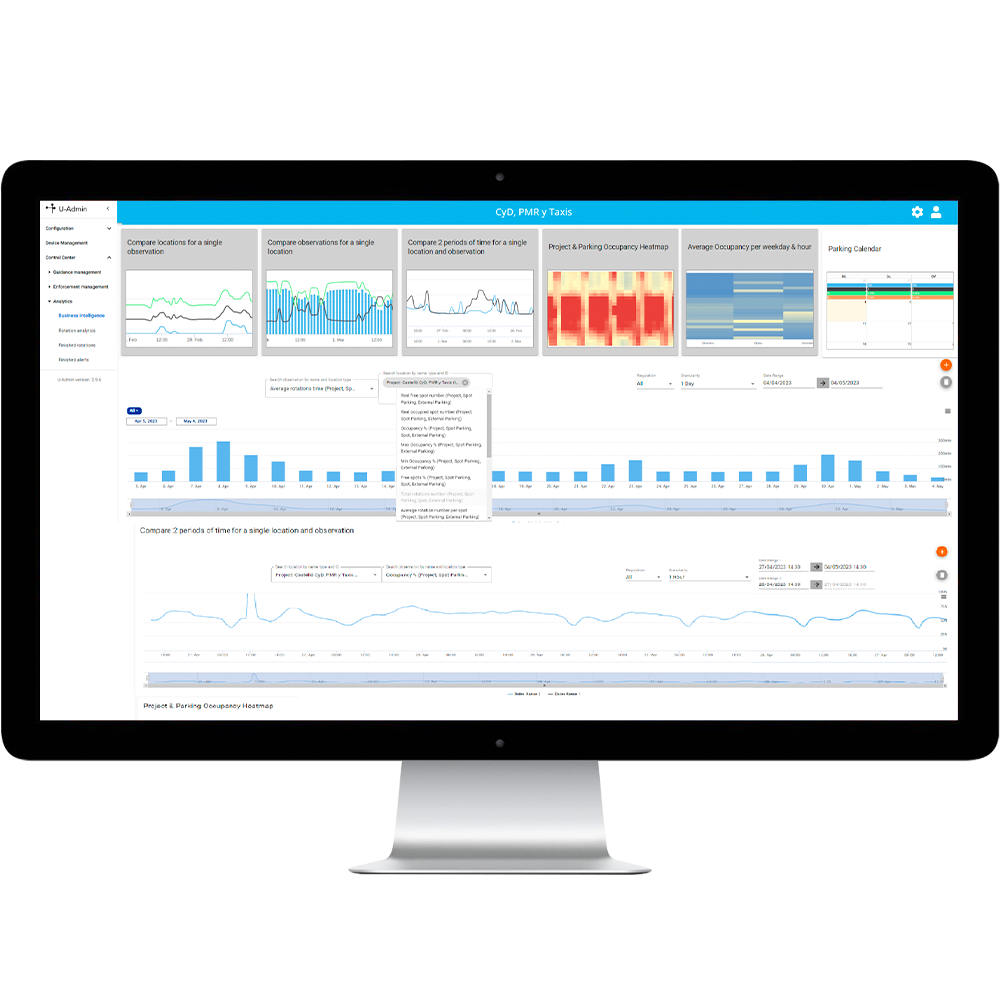
U-Admin Analytics is a tool available in the web version of U-Admin with a host of possibilities and settings that can be changed so the data is optimally displayed. The Business Intelligence section allows the types and number of graphs that are needed for the project to be determined so similar graphs can be displayed with different filters or parameters.
U-Admin Analytics not only offers the data interface but also allows you to view each graph in full screen, print it, or download it in PDF, XLS and CSV format.
Graphs:
- Compare several zones or parking lots according to one type of information
- Compare several types of information for a zone or parking lot
- Compare 2 time periods for information and a zone or parking lot
- Project and Parking Lot occupancy heat map
- Average occupancy by day of the week and time
- Parking calendar
Tables:
- Rotation analyses
- Completed rotations
- Finished alerts
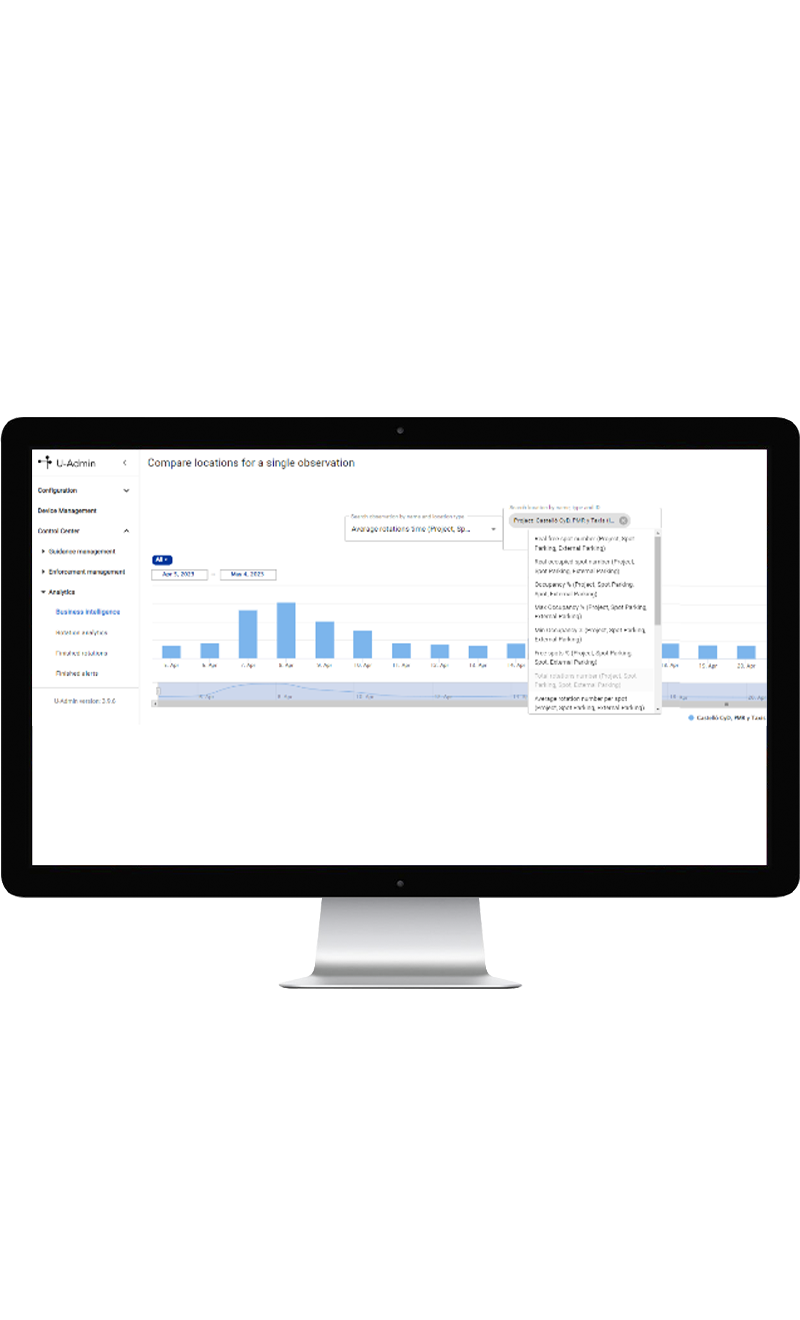
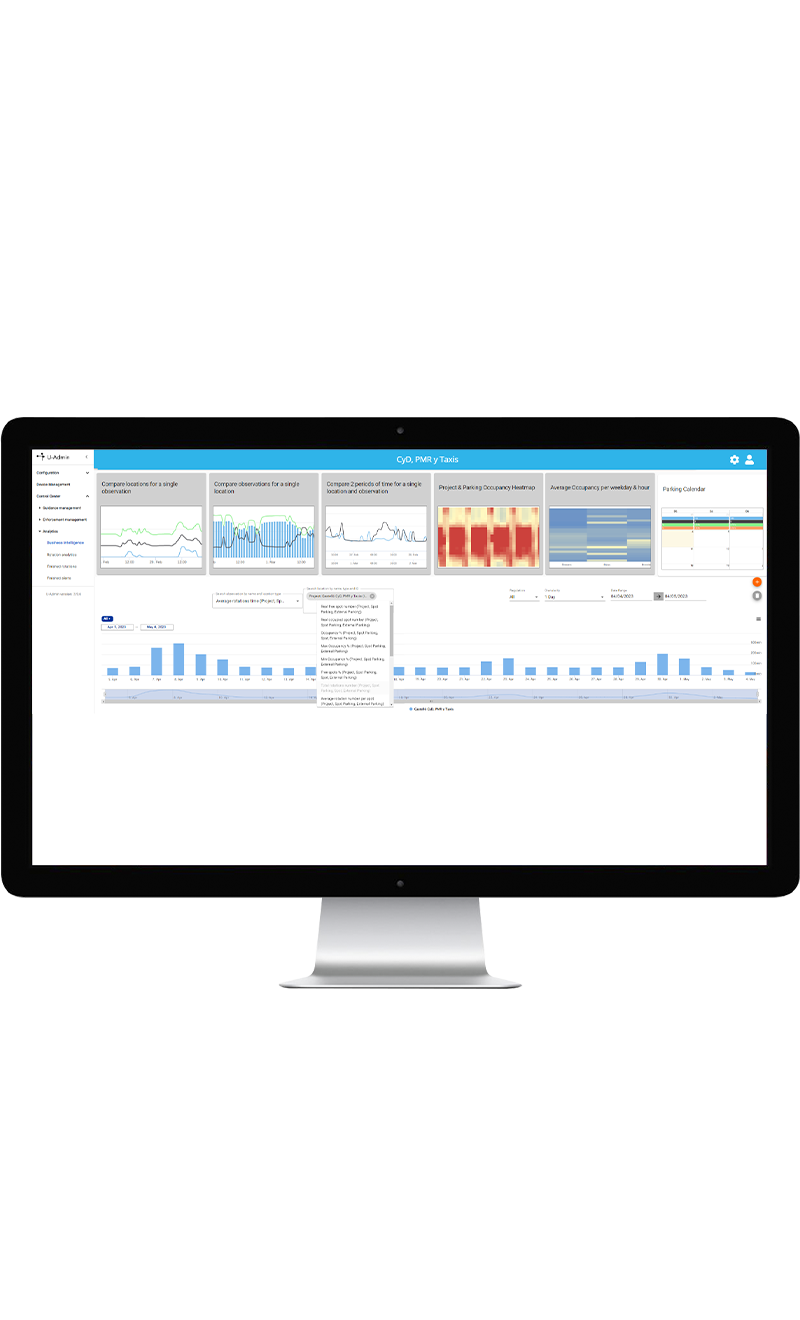
Change the settings on the dashboard the way you want them, with your favorite graphs and the amount of information that best meets your needs
Analyze rotation measurement based on time period, sensors, or whether or not the time is regulated.
Print or download the information that U-Admin analytics offers you, including the revenue generated, your favorite graphs, or the list of notice of reports generated.
- Variety of preconfigured graphs
- List of data in table format
- Variety of filters for further optimization of the data displayed
- Information downloadable in multiple formats